
The strategy we use is very simple. It’s a trend following strategy and is based on a few indicators.
SETUP
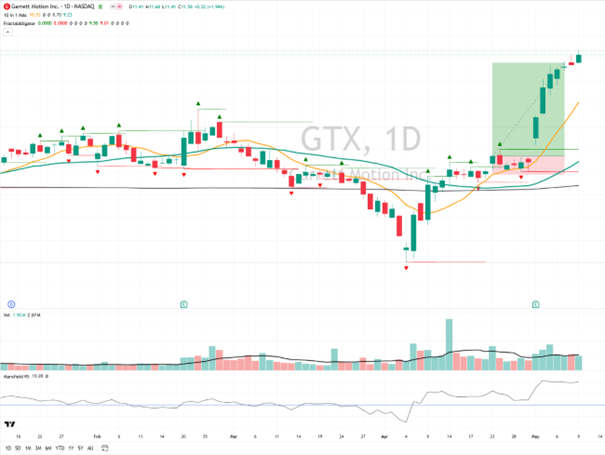
These are the indicators used:
SMA 10
SMA 30
Volume (Volume MA 10)
FractalAlligator (Default, Just the shapes and levels are used)
Mansfield RS (SPX)
All of these are available on several different charting platforms. We use Tradingview as our primary website for charting.

SCREENER
In order to find stocks that are interesting we use a screener to narrow down the selection. The settings on the Daily timeframe are:
Price > 1 USD
ADR > 2 %
Volume > Avg Volume 10D
Price*Vol > 10 M USD
SMA 10 > SMA 30
Open > SMA 10
Price > Open
EXECUTION
What we look for is a stock that is in an uptrend. Our quantitive approach to this is that if the SMA 10 is above the SMA 30, we consider it to be in an uptrend. All trades are placed based on the close of the day. We run our screener for the day before and produce a watchlist that we go through. If we get to many stocks when we run the screener, we tweak the ADR to get a smaller sample of stocks.
The strategy is:
- SMA 10 > SMA 30 (Yellow > Green)
2. Open > SMA 10
3. Price > Open
4. Volume > Volume MA 10
5. Mansfield RS > 0
So if all of the above is true, do we place a trade? No, what we look for is the first time these conditions are true after the price has first closed below SMA 10 and the closed back above SMA 10. We also consider the slope of the SMA 10 and SMA 30, to make sure the momentum is picking up. We also check if the last low fractal is above the previous low fractal (figure below). Granted, since the fractal form after five candles are completed, the low in the top circle would not show up on the chart when the trade is placed. But since we know how a fractal low is charted we also know that it will appear as soon as the candle closes.
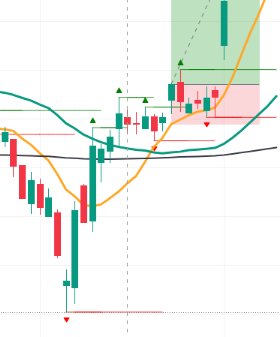
If all the above is true, then we place a trade at the price of the previous days close. The Stoploss is set at the lowest value of the SMA 10 or the low of the signal candle. We always work with a hard stoploss. Sometimes the stock never goes back to the previous days close and that is fine, plenty of more opportunities to come.
RISK MANAGEMENT
Before placing the trade we make a calculation in order to see how many stocks to buy. We work with a set dollaramount of risk. Then we calculate how many stocks to buy so that we don’t risk more than that amount.
R / (EntryP – SL) = No of Stocks
This R or dollaramount might be different for us. Some have a R of $50, some $500 and some $5000.
The goal is to keep the losses small and let the winners run. With this system we get alot of losing trades, but the goal is that the overall profits will be greater.
TRADE MANAGEMENT
When the trade has been placed we wait until it either takes out our stoploss or closes above the high of the entrycandle. If it closes above we move the SL to the SMA 10 of this candle. Then we trail the SL with the SMA 10 for every candle after that. The trade is closed when the SL is hit or the candle closes below the SMA 10. If the candle closes below the SMA 10 at anytime we exit the trade.